HRV Numbers by Age: What's Normal? (Charts + Ranges)
Trying to decode today's HRV number? Use the free interpreter first, then build a practical recovery plan. Interpret your HRV
You've been tracking your HRV for a few weeks. Some days it's 45, other days it's 62, and occasionally it drops to 28. What does this actually mean? Is your HRV "good"? Should you be worried when it drops?
Understanding how to interpret HRV numbers is crucial for getting value from your tracking. In this guide, we'll break down exactly what your readings mean and how to use them to make informed health decisions.
If you're brand new to heart rate variability, start with HRV explained for dummies, then read our complete guide to what HRV is and our beginner's guide.
If your main question is whether a specific low reading is bad, read what a low HRV number means for examples like 20 ms, 30 ms, 40 ms, and 60 ms.
What Your HRV Number Represents
HRV measures the variation in time between consecutive heartbeats, typically expressed in milliseconds (ms). Higher variation generally indicates a well-functioning autonomic nervous system with good stress resilience, while lower variation suggests your system is under strain.
Most consumer devices report HRV using RMSSD (root mean square of successive differences), which primarily reflects parasympathetic (rest-and-digest) nervous system activity. This is the number you see in apps from WHOOP, Oura, Garmin, and Apple Watch.
What Is a "Normal" HRV Range?
Here's the uncomfortable truth: there's no universal "good" or "bad" HRV number. HRV varies enormously between individuals based on:
- Age (HRV naturally declines with age, and ranges differ for children)
- Fitness level (trained athletes typically have higher HRV)
- Genetics (some people naturally run higher or lower)
- Sex (women often have different patterns than men)
- Health conditions (various conditions affect baseline HRV)
General Population Ranges
While individual comparison isn't useful, here are rough population averages for RMSSD:
| Age Group | Typical Range (ms) |
|---|---|
| 20-29 | 40-80 |
| 30-39 | 35-70 |
| 40-49 | 30-60 |
| 50-59 | 25-50 |
| 60+ | 20-45 |
Important: These are approximations. Someone with an HRV of 25 isn't necessarily unhealthy, and someone with an HRV of 90 isn't automatically in great shape. Your personal baseline is what matters.
Why Personal Baseline Matters More Than Absolute Numbers
The most important insight in HRV interpretation: track your own trends, not population averages.
After 2-3 weeks of consistent tracking, you'll establish your personal baseline. This is far more valuable than comparing yourself to others because:
- Deviations from YOUR baseline signal meaningful change
- Your body's response patterns are unique
- Lifestyle factors affect everyone differently
A 10% drop from your personal average is significant regardless of whether your baseline is 35 or 75.
Understanding Daily Fluctuations
Your HRV will fluctuate daily. This is normal and expected. Here's what drives those changes:
Factors That Temporarily Lower HRV
- Poor or insufficient sleep (see our HRV and sleep guide)
- Alcohol consumption (even moderate amounts; see alcohol and HRV)
- High training load or intense exercise the previous day
- Acute stress or emotional events
- Illness or fighting infection (often detectable before symptoms appear)
- Surgery and early postoperative recovery (see HRV after surgery)
- Dehydration
- Late meals or heavy eating before bed
- Travel and jet lag
Factors That Support Higher HRV
- Quality sleep (7-9 hours, good sleep efficiency)
- Regular aerobic exercise (with adequate recovery)
- Stress management practices like meditation
- Breathing exercises and HRV biofeedback
- Good nutrition (see nutrition and HRV)
- Cold exposure (when adapted)
- Social connection and positive emotions
How to Read Your HRV Trends
Short-Term (Day-to-Day)
Daily fluctuations of 10-20% from your baseline are normal. Don't overreact to single-day readings. Instead, look for:
- Consecutive low days (3+ days below baseline may indicate accumulated stress or overtraining)
- Unexpected drops (significantly below baseline without obvious cause warrants attention)
- Recovery patterns (how quickly you bounce back after stressors)
Medium-Term (Weekly Trends)
Your 7-day rolling average smooths out daily noise and reveals more meaningful patterns:
- Upward trend = positive adaptations, good recovery, effective lifestyle changes
- Downward trend = accumulated stress, insufficient recovery, potential overtraining
- Stable trend = homeostasis (which can be good or indicate a plateau)
Long-Term (Monthly/Yearly)
Over months, you should see your baseline gradually improve if you're making positive lifestyle changes. If your baseline is declining long-term despite healthy habits, consult a healthcare provider.
Common HRV Interpretation Mistakes
Mistake 1: Comparing to Others
"My friend's HRV is 75 and mine is only 40" is meaningless. Different devices measure differently, individual baselines vary wildly, and HRV is highly personal. Stop comparing.
Mistake 2: Chasing High Numbers
Some people become obsessed with getting the highest possible HRV. This misses the point. HRV is a tool for awareness and adjustment, not a competition. An artificially elevated HRV from overbreathing or measurement timing tricks provides no actual health benefit.
Mistake 3: Overreacting to Single Readings
One low HRV day doesn't mean you're sick, overtrained, or dying. Bodies fluctuate. Look at patterns over days and weeks, not isolated data points.
Mistake 4: Ignoring Context
A low HRV reading after a hard workout, a late night out, or a stressful day at work is expected and appropriate. Your nervous system is responding correctly. Concern is warranted when HRV drops without explanation.
Mistake 5: Not Tracking Consistently
For meaningful insights, measure HRV the same way, at the same time, every day. Morning measurements immediately after waking provide the most consistent baseline. Inconsistent tracking makes interpretation nearly impossible.
Using HRV Data to Guide Decisions
Training Decisions
Many athletes and fitness enthusiasts use HRV to guide training intensity:
- HRV at or above baseline = Green light for planned training
- HRV 5-10% below baseline = Consider reducing intensity
- HRV significantly below baseline = Prioritize recovery
The WHOOP recovery score and Oura readiness score automate this interpretation. For athletes, our HRV for athletes and overtraining guide go deeper on this topic.
Lifestyle Experiments
HRV is excellent for testing how lifestyle changes affect you personally:
- Establish baseline (2-3 weeks of normal behavior)
- Change one variable (new supplement, different sleep schedule, etc.)
- Track for 2-4 weeks
- Compare to baseline
This approach reveals what actually works for YOUR body, not what studies say works on average.
Early Warning System
Experienced HRV trackers often notice HRV drops 24-48 hours before illness symptoms appear. If your HRV suddenly tanks without obvious cause, consider:
- Extra sleep
- Reduced training load
- Immune support (vitamin C, zinc, etc.)
- Monitoring for symptoms
Device Differences and Comparability
Why Different Devices Show Different Numbers
If you've used multiple HRV devices, you've noticed they report different numbers. This happens because:
- Different algorithms for calculating RMSSD
- Different measurement windows (30 seconds vs. 5 minutes)
- Different sensors (optical vs. ECG accuracy)
- Different measurement times (overnight vs. morning spot-check)
Comparing Devices
The Oura Ring 4 measures overnight and reports an average. WHOOP also measures during sleep but uses different processing. Apple Watch typically measures during specific breathing sessions or overnight.
For detailed comparisons, see our comparing HRV monitors guide and our Garmin vs Polar breakdown.
Key point: Pick one device and stick with it. Trends within a single device are meaningful; comparing numbers across devices is not.
When to Be Concerned
While daily fluctuations are normal, certain patterns warrant medical attention:
- Persistently low HRV (baseline significantly below age-appropriate range with no improvement over months)
- Sudden dramatic drop (50%+ below baseline without clear cause)
- HRV declining long-term despite healthy lifestyle
- Accompanying symptoms (chest pain, palpitations, unusual fatigue, shortness of breath)
HRV is a valuable health metric, but it's not a diagnostic tool. Use it for awareness and optimization, not medical diagnosis.
The Bottom Line
Understanding your HRV numbers comes down to three principles:
- Your baseline is personal and more important than population averages
- Trends matter more than single readings
- Context determines interpretation
Track consistently, look for patterns, use the data to guide decisions, and don't obsess over daily fluctuations. Over time, you'll develop intuition for what your HRV is telling you and how to respond.
For practical ways to improve your numbers, explore our guide on 10 science-backed ways to improve your HRV.
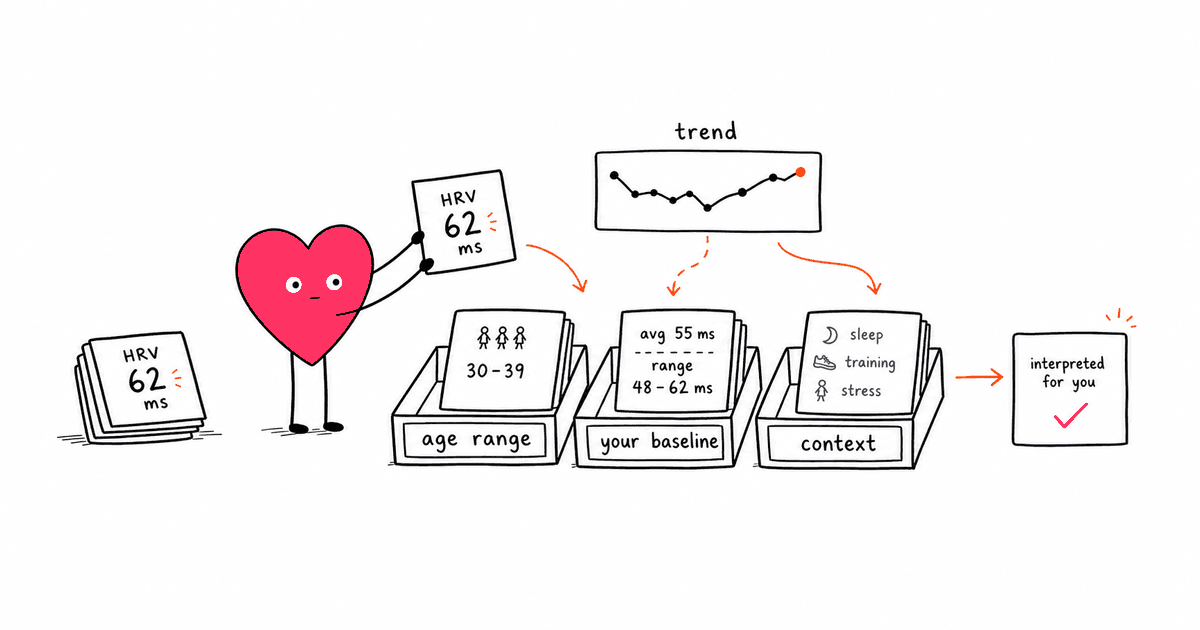
Need a quick read on your HRV number first?
Enter your HRV value, age range, device, and recovery context for a plain-English interpretation before you decide what to do next.
Interpret Your HRV NumberBuild the 30-day plan